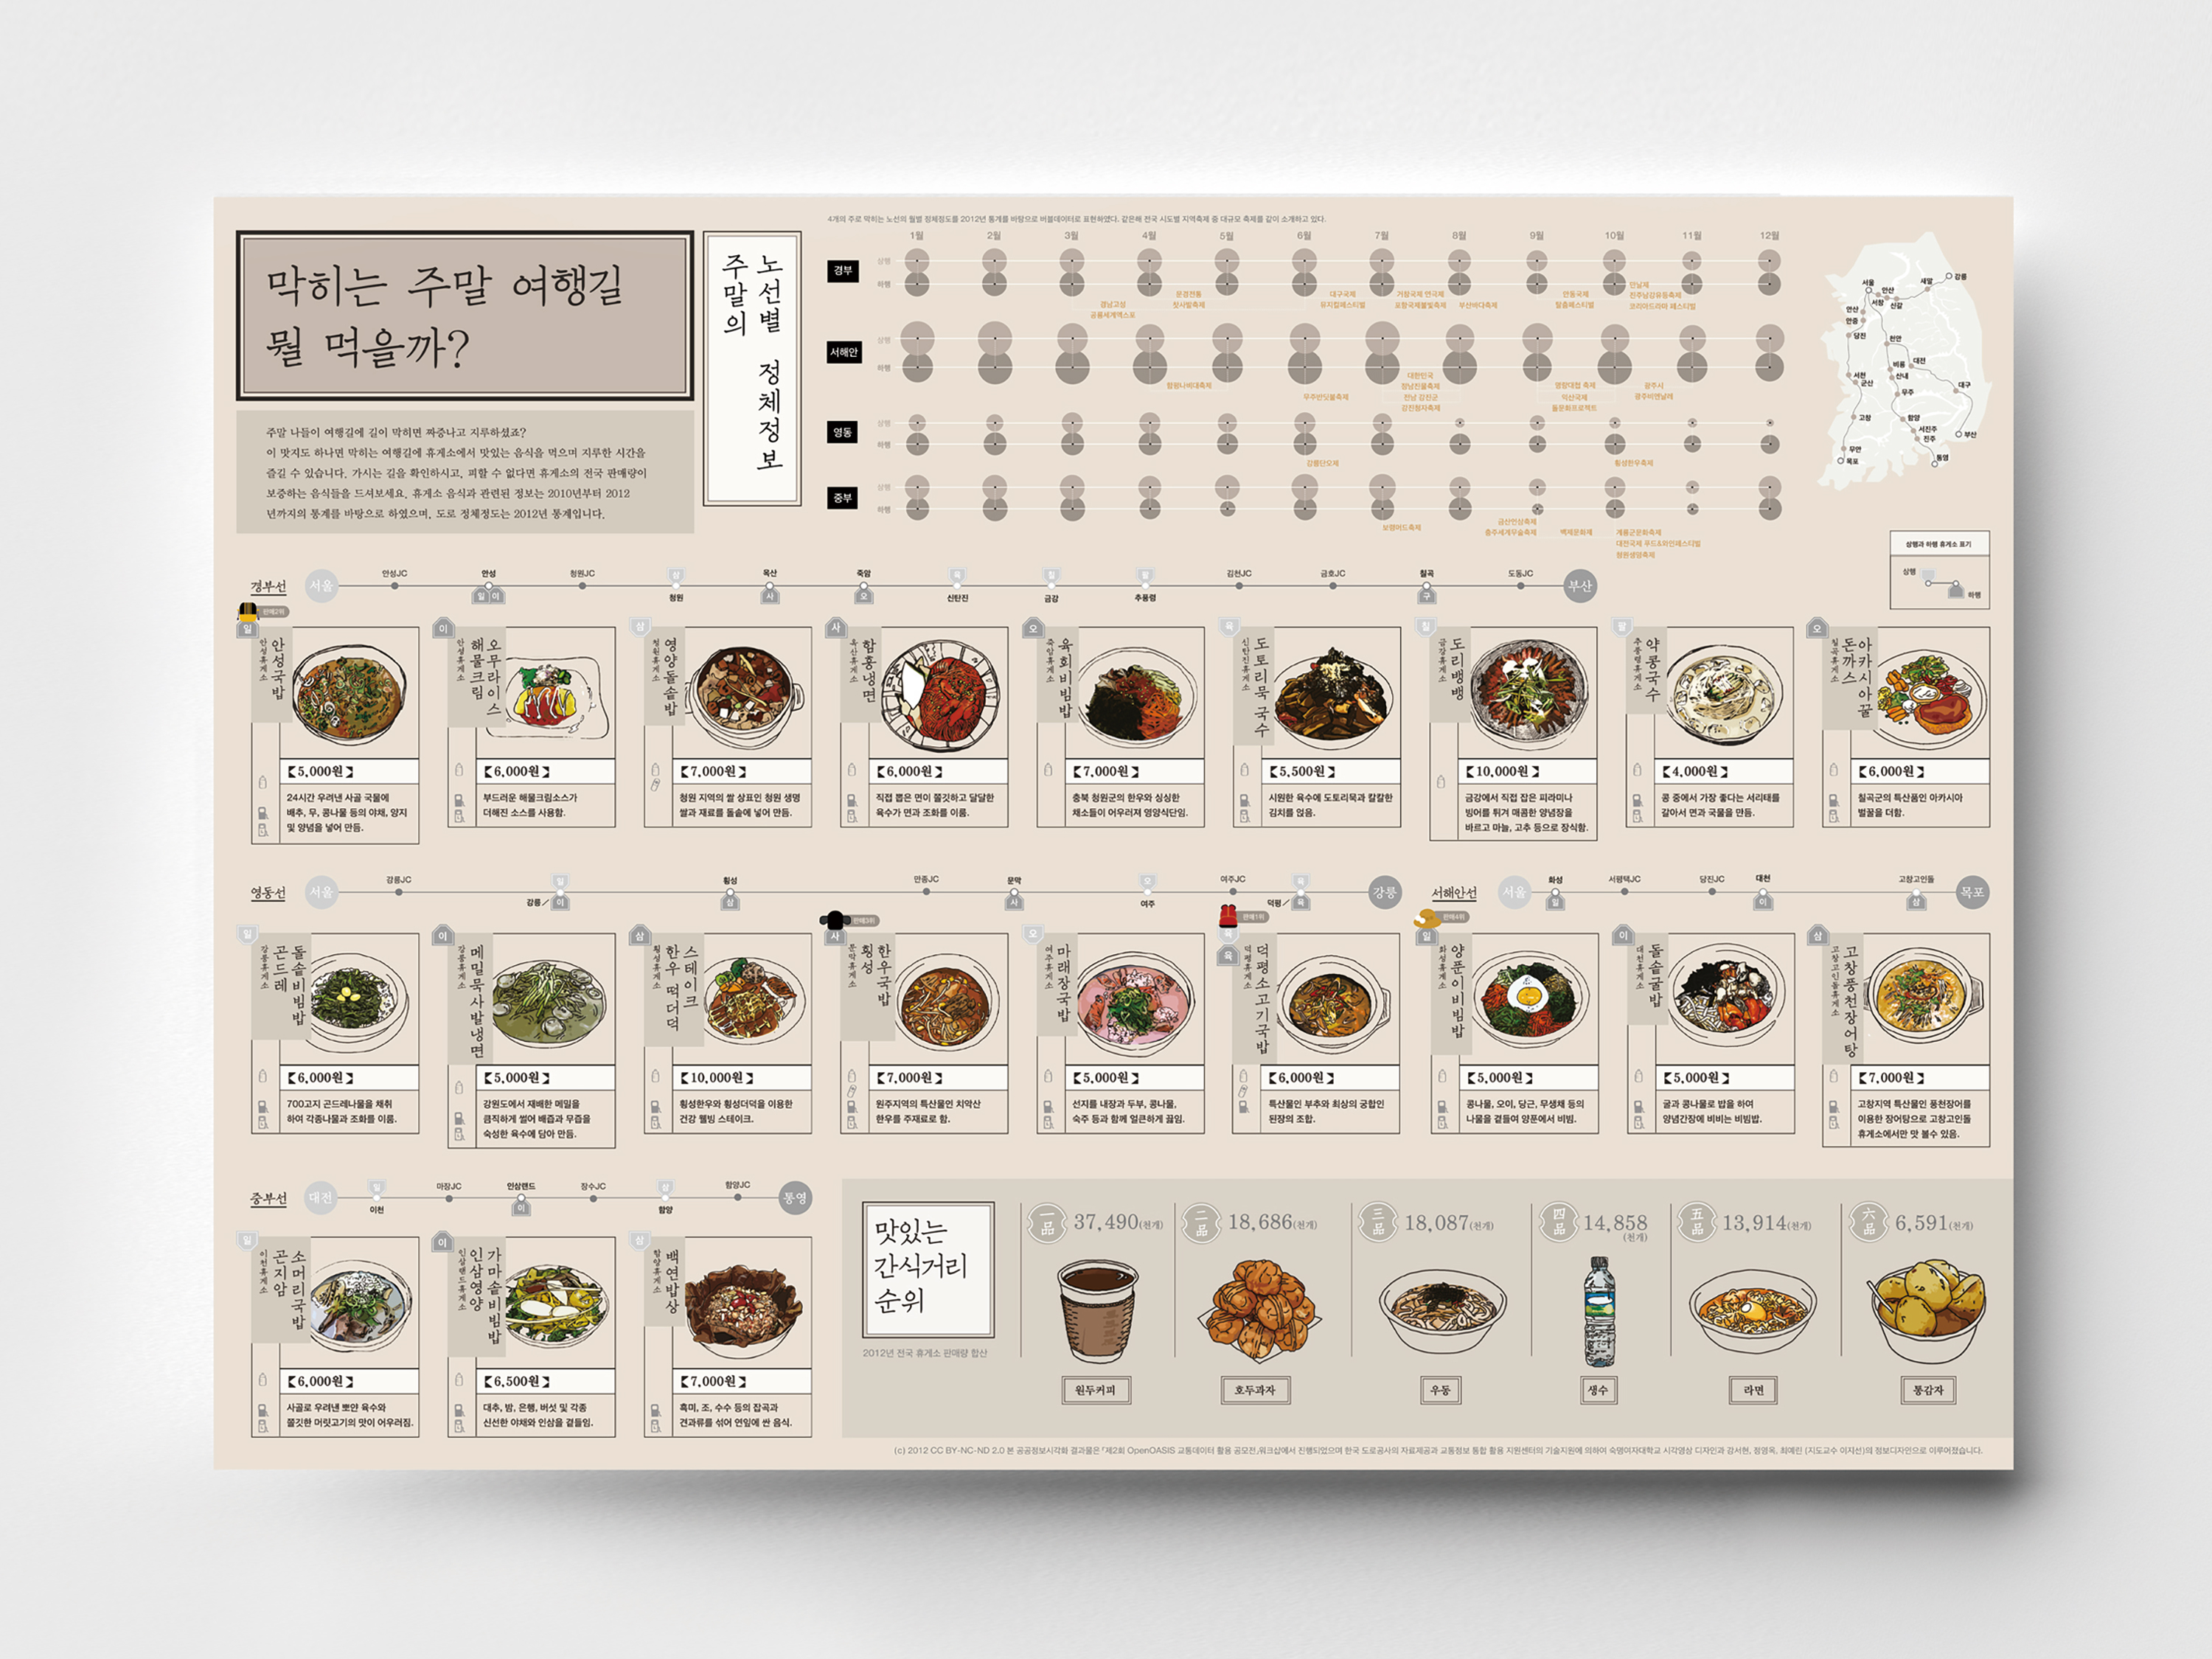
This infographic is about the delicious foods in Korean highway service areas. It was designed to suggest a way for people to use highways enjoyable on weekends and holidays.
This infographic covers mainly two pieces of information. The top section shows the weekend traffic congestion average. Weekend traffic congestion varies from month to month, which is visualized using the size of the circle. In the lower part, the most delicious food in each service area of highway sections was illustrated intuitively.
Published in Korea Highway Corporation, 2013
Team
Yerin Choi
Young-ok Jung
Seo-hyun Kang
My Role
1) Research: take a look at data possessed by the Korea Highway Corporation and choose topic
2) Brainstorming: conceptualize ideas
3) Design: illustrate foods
A map of the best food in Korean highway service areas
![]()
![]()