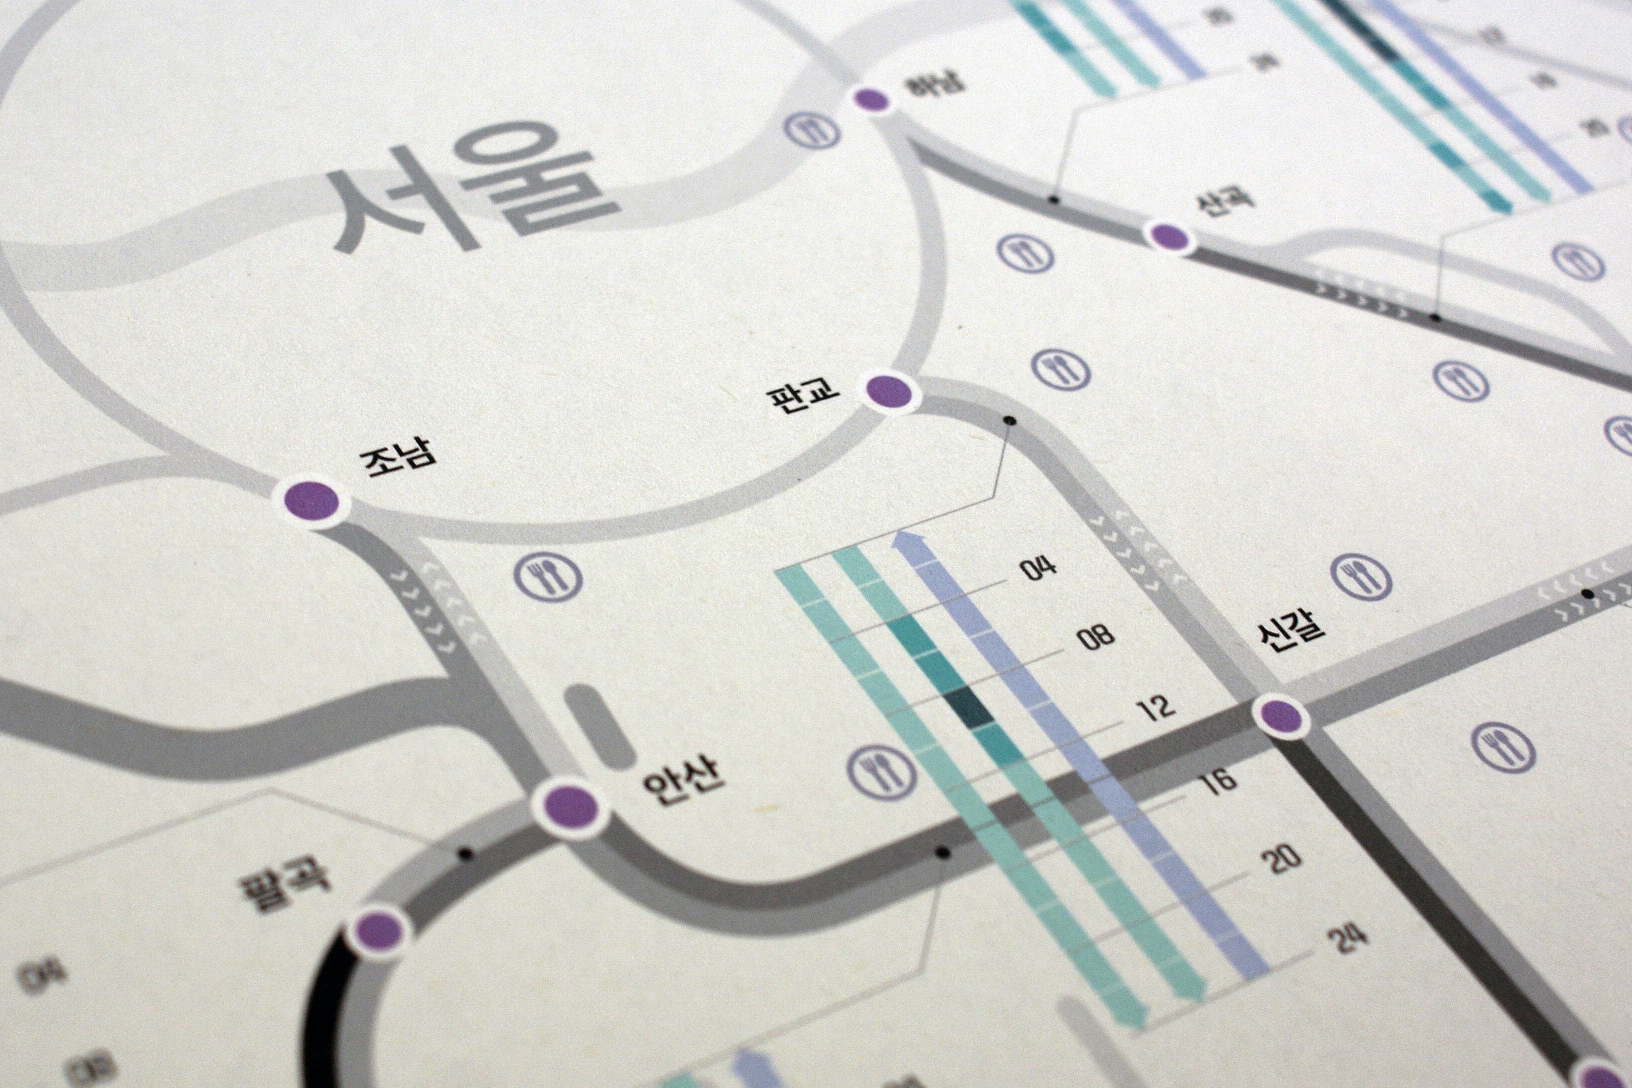
This data visualization shows the expected traffic congestion of highways during the Chuseok, also known as Korean Thanksgiving Day. The traffic congestion data of the past accumulated by the Korea Expressway Corporation was analyzed to predict the congestion for the upcoming holiday.
In the above part, people can know the expected degree of traffic congestion of highways with different colors. The path to go down is green and the path to go up is purple. In the lower part, people can see the estimated travel time between major cities. By distinguishing the color and size of the circles, it is intuitive to know which section is expected to be crowded by time zone.
Published in Korea Highway Corporation, 2013
Team
Yerin Choi
Young-ok Jung
Seo-hyun Kang
My Role
1) Research: have meetings with data scientists at the Korea Expressway Corporation
2) Data selection: take a look at data and consolidate it
3) Brainstorming: conceptualize ideas and make decisions on the possible design directions
4) Design: visualize data on the map
Traffic congestion forecast during the Chuseok in 2013
![]()
![]()